Stirling motors
With this document we want to illustrate a laboratory activity that consists in the analysis of the energy efficiency of a thermal machine. This is done using brightness and temperature sensors controlled by a central logic unit. The purpose of this activity is to develop theoretical thermodynamic skills and experimental physics skills related to the realization of a measure. Students will collect and analyze data, programming a logical unit.
Preparing For This Tutorial:
The materials used for this laboratory are listed below. They were mounted as shown in the figure 1.
• A Stirling cycle thermal machine
• A temperature sensor
• A brightness sensor
• The programmable logic unit MINDSTORM EV3
• A kettle for the production of water vapor
• A second thermometer to check the temperature of water vapor
The Stirling machine is positioned above the heat source, and the sensors connected to the MINDSTORM EV3 logic unit are positioned on it.
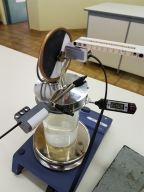
Figure 1: the experimental apparatus
Time constraints:
starting from 90 min - double lesson
Exercise
Analysis of the energy efficiency of a thermal machine.
Theory
Introduction
The students have a Stirling cycle thermal machine (easily available on amazon.com) that absorbs heat from a metal plate at a temperature of Tupand releases it into the environment from a second plate at a temperature of Tdown. The flow of heat through the machine causes a metal wheel to rotate. The two working temperatures determine both the efficiency of the machine and the amount of work produced. This work turns into rotational kinetic energy of the metal wheel. Once the operating temperatures have been set, the wheel’s rotation frequency will be constant, and the work produced by the thermal machine will be used to compensate parts. for kinetic energy losses due to friction caused by moving mechanical
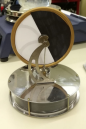
Figure 1: A Stirling machine
The machine performance analysis consists in the simultaneous monitoring of the two working temperatures and of the wheel rotation frequency. The overall experimental apparatus is shown in the figure 5.
Scientific analysis of this problem
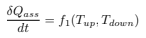
A thermal machine is a technological device that absorbs heat and transforms part of it into work. Heat flow inside the machine depends on the two working temperatures:
In the experimental case we will analyze, the temperature at which the heat is absorbed is constant: Tup= 100◦C
The performance of an ideal Stirling machine is the same as that of the
Carnot cycle

The efficiency of our machine will certainly be much smaller, but always dependent on the two working temperatures. The amount of heat that flows through the machine is also dependent on the two working temperatures. The work produced by the machine in the unit of time is therefore given by the following expression which also depends on the two working temperatures
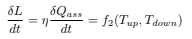
This work is used to compensate for the work of frictional forces. These depend on the rotation frequency of the wheel. So the work produced is also proportional to the rotation frequency of the wheel
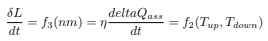
At this point, although we do not know the analytical expression of the rotation frequency as a function of the working temperatures, we have certainly shown that for the rotation frequency we will have
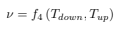
Since the temperature Tupis constant, we will have that

and in particular the frequency decreases with increasing Tdown.
Experimental configuration
The heat source
To simplify the experimental apparatus, boiling water is used as a high temperature heat source, whose steam has a constant temperature Tup= 100◦C. A becker full of water is placed on a heat source. The Stirling machine is positioned on the beaker receiving the steam on the lower plate.
Wheel preparation and frequency measurements
In order to observe the movement of the wheel, a colored mask was applied to it as shown in the figure. Frequency measurement is performed using the reflected brightness sensor. Half of the wheel is white, the other half is black. Every time the sensor perceives two passages between zones of different colors, then we consider that the wheel has made a rotation.

Data taking
The data is taken by the simultaneous measurement of the temperature of the upper plate of the Stirling machine, and of the measurement of the interval of time spent in a fixed number of revolutions of the wheel of the Figure 3 machine. In the figure ref device it is possible to see the operating configuration during data acquisition.
Operating limits
A measure of this type requires that the sensor performs at least one measurement every half turn, so the sensor sampling speed must be at least twice that of the wheel rotation. This imposes a limit on the maximum rotation frequency that can be measured by the instrument. Since the sampling frequency is 1 kHz, the sensor is far more efficient than is necessary.
Choice of sensor setting
The light sensor can recognize if the wheel is positioned with the dark side in front of the sensor in two ways: measuring the reflected brightness or measuring the color. The color measurement did not give satisfactory results as explained below.
Color detector test The color measurement, given the apparatus in question, must always be white or black. In this first test we want to measure how many times we get a false color identification from the sensor. To do this, we measure the identified color spectrum on 100, 000. The obtained data are shown in the table 1 It follows that the closer the wheel is to the sensor, the better the color reading is. This is due to all the readings that occur when the light circle produced by the sensor falls over the separation line between the white and black areas. In any case, the color reading did not seem sufficiently reliable.
Distance |
None |
Black |
Blue |
Green |
Yellow |
Red |
White |
Brown |
|---|---|---|---|---|---|---|---|---|
14 mm |
0 |
46324 |
11146 |
0 |
0 |
0 |
42355 |
175 |
10 mm |
0 |
46150 |
2643 |
0 |
0 |
0 |
51035 |
172 |
6 mm |
0 |
47982 |
332 |
0 |
158 |
0 |
51393 |
135 |
Table 1:
Reading of the color by the sensor on a rotating disk whose interior is colored half white and half black. Data are obtained with the software TestCol orSensor. It can be seen that depending on the distance, the accuracy of the color reading varies.
Reflected brightness detector test Observing the response of the reflected light sensor when the sensor is positioned on the white part and on the black part of the wheel, we note that the separation is very clear. The intermediate level of brightness will be chosen as a separation between the revelation of black and the revelation of white.
Sources of error in the measurement
Temperature measurement
The source of error on temperature measurement is due to the sensitivity of the instrument used. Wanting to relate the rotation frequency to the working temperature, we must assume that the temperature is constant within the time interval in which the frequency measurement takes place. Since this is not necessarily true, an average temperature will be considered with the consequent addition of a further element of uncertainty in the measurement. To measure the average temperature, the temperature will be measured immediately before and immediately after the frequency measurement.
Rotations counting
The error in counting the number of rotations in a given time interval is one quarter of a turn on the starting measure and a quarter of a turn in the finish measure. We will therefore have an overall error of half a turn, independent of the number of laps counted.
Measurement of time intervals
The time measurement is performed by the programmable logic unit and therefore we assume negligible measurement errors compared to other sources of error in our laboratory work.
Analysis of the software used
The software used for data taking is FreqVsTemp.
The software follows the following algorithm:
Measurement of the reflectivity of the disk (measured with the moving disk) for the measurement of average reflectivity
chronometer initialization and temperature reading
counting of a certain number of wheel revolutions
reading of the chronometer value and temperature
frequency calculation
write data to file RawData
The Python code used for the data capture is shown in the appendix A.
Achieved results
The results obtained consist of three sets of data (ν, Tbefore, Tafter) Data anal ysis involves processing each triad in (ν, Tmedia) and these data pairs were then represented on a graph. From the graph in figure 4 we can clearly see how, as temperature increases, the rotation frequency decreases, exactly as expected.
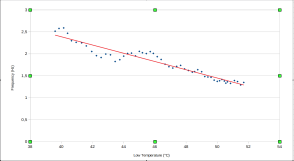
Figure 4: Trend of the wheel rotation frequency as a function of the operating temperature: Tdown. The temperature Tupis the boiling temperature of the water
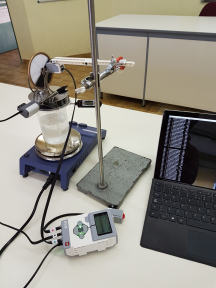
Figure 5:
The experimental apparatus as a whole
Short help on programming
A Software FreqVsTemp
#!/usr/bin/env python3

import time

from ev3dev2.sensor import INPUT_2

from ev3dev2.sensor.lego import TouchSensor, ColorSensor, Sensor from ev3dev2.sound import Sound
Functions definition
#!/usr/bin/env python3

def WaitFor(color, threshold, sensor):

  if color == ’black’:

    while sensor.reflected_light_intensity >= threshold : time.sleep(0.001)

  else :

    while sensor.reflected_light_intensity < threshold : time.sleep(0.001)

def MyPrint(out_file,text):

  "print a text line on a file and on the screen"

  print(text)

  text=text+"\n"

  out_file.writelines(text)

def MySpeak(sound,text):

  "print a text line on the screen and speak it"

  print(text)

  sound.speak(text)
Objects creation
#!/usr/bin/env python3

cl = ColorSensor()

tc = TouchSensor()

temperature_sensor = Sensor(INPUT_2)

temperature_sensor.mode = "NXT-TEMP-C"

sound = Sound()

MySpeak(sound,’Opening raw data file’)

out_file = open("FrequencyVsTemperatureData.txt","w")

MyPrint(out_file,time.strftime("%d/%m/%Y - %H:%M:%S"))
Measurement of average brightness
#!/usr/bin/env python3

average_luminosity = 0

MySpeak(sound,’Press the button’)

tc.wait_for_pressed()

MySpeak(sound,’In how many seconds will the mesure be done?’) number_of_data = 0

Time_of_Mesure = float(input(’Time = ’))

end_ticks = time.time()+Time_of_Mesure

while time.time()<end_ticks :

  number_of_data = number_of_data +1

  average_luminosity = average_luminosity + cl.reflected_light_intensity

  average_luminosity = average_luminosity/number_of_data

MyPrint(out_file,"average luminosity = "+str(average_luminosity)+"\n")
MyPrint(out_file,"T_{ini} - Frequency - T_{fin}\n")
Rotation frequency measurement
#!/usr/bin/env python3

Frequency = 0

NumberOfCicles = int(input(’Number of cicles = ’)) myRange = range(1,NumberOfCicles+1)

while not tc.is_pressed:

  WaitFor(’black’,average_luminosity,cl)

  Tini = temperature_sensor.value()

  StartingTime = time.time()

for count in myRange:

  WaitFor(’white’,average_luminosity,cl)

  WaitFor(’black’,average_luminosity,cl)

  ElapsedTime = time.time()-StartingTime

  Frequency = NumberOfCicles/ElapsedTime

  Tfin = temperature_sensor.value()

  MyPrint(out_file,str(Tini)+" - "+str(Frequency)+" - "+str(Tfin))

  MySpeak(sound,’Closing raw data file’)

  out_file.close()

  MySpeak(sound,’This program ends here’)
Software TestColorSensor
#!/usr/bin/env python3

import time

from ev3dev2.sensor.lego import TouchSensor, ColorSensor from ev3dev2.sound import Sound
Functions definition
#!/usr/bin/env python3

def MyPrint(out_file,text):

  "print a text line on a file ad on the screen"

  print(text)

  text=text+"\n"

  out_file.writelines(text)

def MySpeak(sound,text):

  "print a text line on the screen and speak it"

  print(text)

  sound.speak(text)
Objects creation
#!/usr/bin/env python3

cl = ColorSensor()

cl.mode=’COL-COLOR’ # Put the color sensor into COL-COLOR mode. tc = TouchSensor()

sound = Sound()

MySpeak(sound,’Opening raw data file’)

out_file = open("ColorSensorData.txt","w")

MyPrint(out_file,time.strftime("%d/%m/%Y - %H:%M:%S"))
Color detection
#!/usr/bin/env python3

MySpeak(sound,’Press the button’)

tc.wait_for_pressed()

colors_array = [0,0,0,0,0,0,0,0]

MySpeak(sound,’How many data do you want to collect?’)

max_data = int(input(’N = ’))

current_data = 0

while current_data<max_data:

  current_data = current_data+1

  index = cl.value()

  colors_array[index] = colors_array[index]+1

  MyPrint(out_file,’colors=unknown-black-blue-green-yellow-red-white-brown’) myRange = range(0,8)

  text = ’colors = ’

  for count in myRange:

    text = text + str(colors_array[count])+’ - ’

    MyPrint(out_file,text)

    MySpeak(sound,’Closing raw data file’)

    out_file.close()

    MySpeak(sound,’This program ends here’)